RankingSorted by descending score. Helps identify underperforming zones
Avg of all restroom health scores within each facility zone. Updated every 5 min.
1
Ground Floor Male
96%
2
Level 2 Female
94%
3
Ground Floor Female
91%
4
Basement Unisex
82%
Operations Overview gives C-level & facility managers a single-glance value summary. All metrics are read-only. Export generates a branded PDF report for board presentations.
Live Status Board
Real-time restroom status across your facility
LIVE
🏢
24
Total Restrooms
✅
19
Clean / Within SLA
⚠️
3
Needs Attention
🚨
2
SLA Breach
Tile Legend:Green (90-100%) — Clean, within SLAAmber (75-89%) — Due soon, needs attentionRed (<75%) — SLA breach, overdueBlue — Cleaning in progress
"In progress"Robot currently cleaning. Score hidden until cycle completes
Real-time sensor + robot data. Auto-refreshes every 30 seconds.
Ground Floor
8 restrooms · Last updated 30s ago
G-Floor
Male A
96%
Cleaned 12 min ago
G-Floor
Female A
94%
Cleaned 18 min ago
G-Floor
Male B
72%
Due in 8 min
G-Floor
Female B
91%
Cleaned 22 min ago
G-Floor
Accessible
98%
Cleaned 5 min ago
G-Floor
VIP Lounge
58%
⚠ SLA BREACH - 14min overdue
G-Floor
Staff WC
89%
Cleaned 28 min ago
G-Floor
Lobby Unisex
—
🤖 Cleaning in progress
Level 2
6 restrooms · Last updated 30s ago
Level 2
Male
93%
Cleaned 15 min ago
Level 2
Female
95%
Cleaned 10 min ago
Level 2
Family Room
68%
Due in 3 min
Level 2
Office Wing
90%
Cleaned 20 min ago
Level 2
Food Court
52%
⚠ SLA BREACH - 22min overdue
Level 2
Accessible
87%
Cleaned 35 min ago
Simplified read-only Digital Twin. Customers see cleanliness status without operational controls. Color-coding (Green/Amber/Red/Blue) gives instant understanding. Click a tile to see supply levels and last-cleaned details (drill-down modal).
Performance Trends
Track improvements over time
Cleanliness Score Trend
↑ +14% over 90 days
Chart Legend
Cleanliness Score = AI Vision Score (post-clean avg across all restrooms)
Green LineMonthly avg cleanliness score from AI photo analysis
Green DashTarget threshold (90%) from SLA configuration
+14% over 90d(Current score - Score 90 days ago) / Score 90 days ago × 100
Data PointsMonthly avg from daily AI vision scores of all after-clean photos
AI vision model scoring all robot after-cleaning photos. Monthly average.
Staff Productivity Gains
Tasks per Staff per Day
14
22
Jan
14
24
Feb
15
26
Mar
14
28
Apr
13
31
May
14
32
Jun
Before ALIX
With ALIX
Chart Legend
Tasks/Staff/Day = Total Completed Tasks / Active Staff Count / Working Days
Grey BarPre-ALIX baseline: manual tasks per staff member per day (historical)
Blue BarWith ALIX: tasks completed per staff (humans focus on high-value tasks)
GrowthStaff handle 2x more tasks because robots cover routine cleaning
Feedback kiosk system + mobile app. Aggregated over selected time period.
Performance Trends is designed for quarterly reviews and board presentations. All charts are exportable. The before/after comparison reinforces ALIX's value proposition.
Cleaning Verification
Before & after vision verification captured by ALIX robots
📸
94
Vision Scans Today
✅
47
Verified Clean Cycles
🤖
96%
AI Quality Pass Rate
⚠️
2
Flagged for Review
Metrics Guide:
Cleaning Verification Metrics
Vision ScansTotal before + after vision scans taken by all robots today. Each fixture = 2 scans (before + after)
Verified CyclesComplete clean cycles where both before & after scans passed AI review. = Scans / 2 where both scored ≥80%
AI Pass Rate = Cycles with Score ≥ 80% / Total Cycles × 100 Quality Score = Weighted avg of 12 inspection parameters (see AI checklist)
Quality ScorePer-cycle: AI vision model scores 12 parameters (bowl, seat, lid, sink, mirror, soap, paper, bin, urinal, handles, freshener, odor). Each 0-100, weighted avg = final score
Pass (≥80%)All critical parameters met. No human follow-up needed
Flagged (60-79%)One or more parameters below threshold. Human review required
AI vision model (YOLOv8 + custom cleanliness classifier). Vision data stored 90 days for audit.
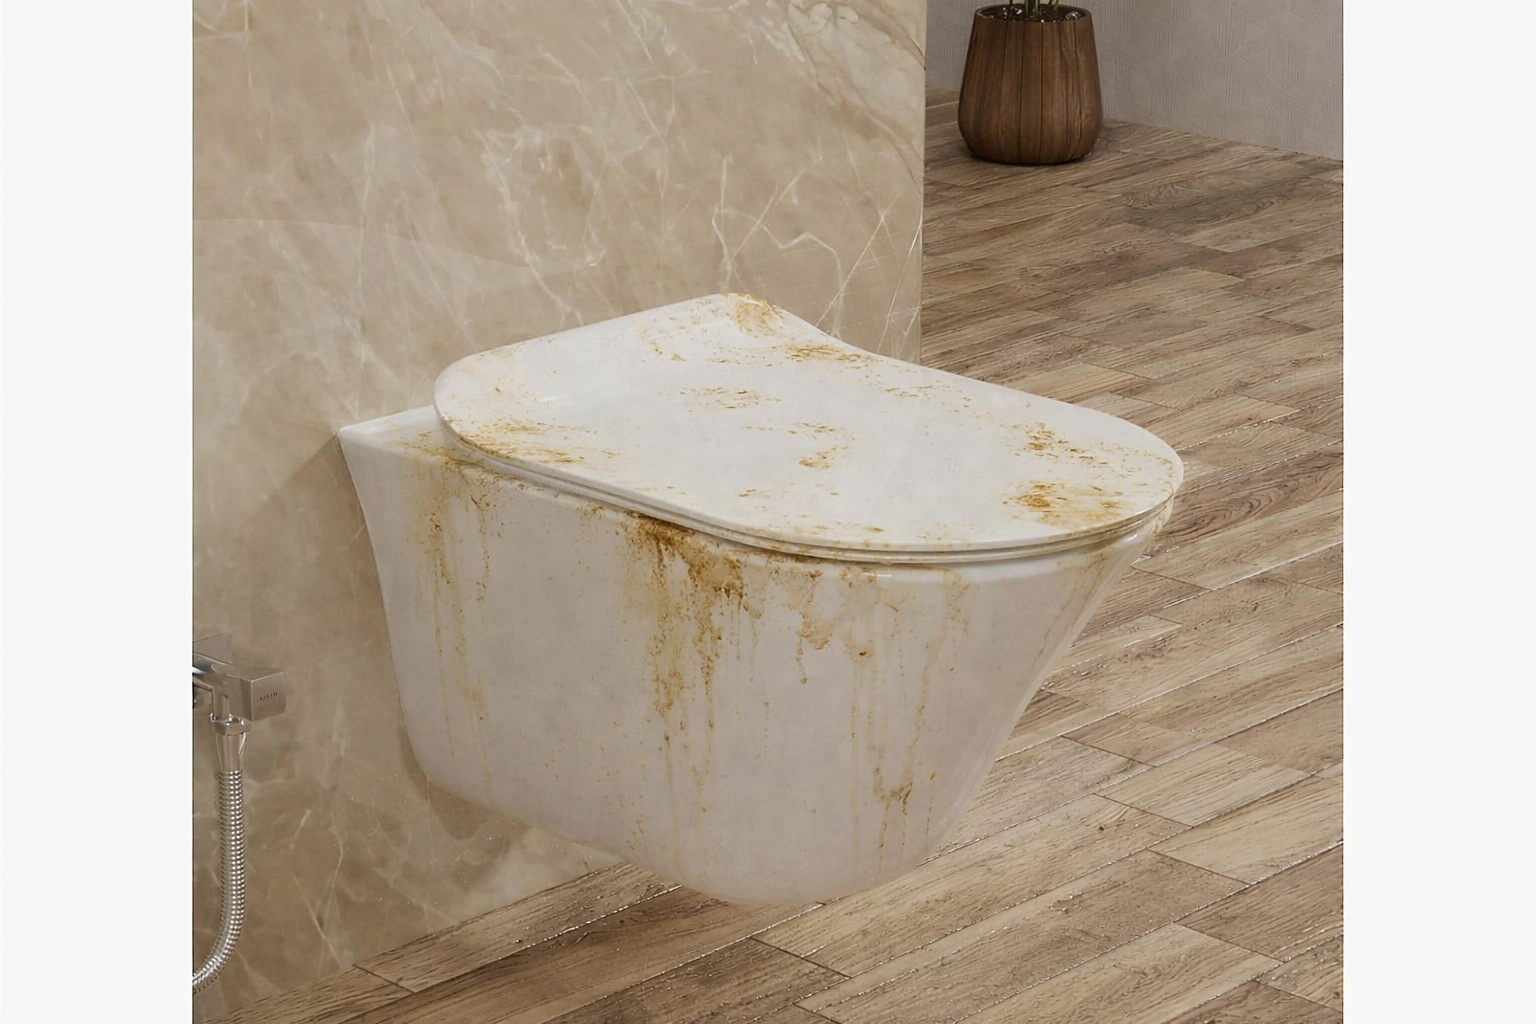
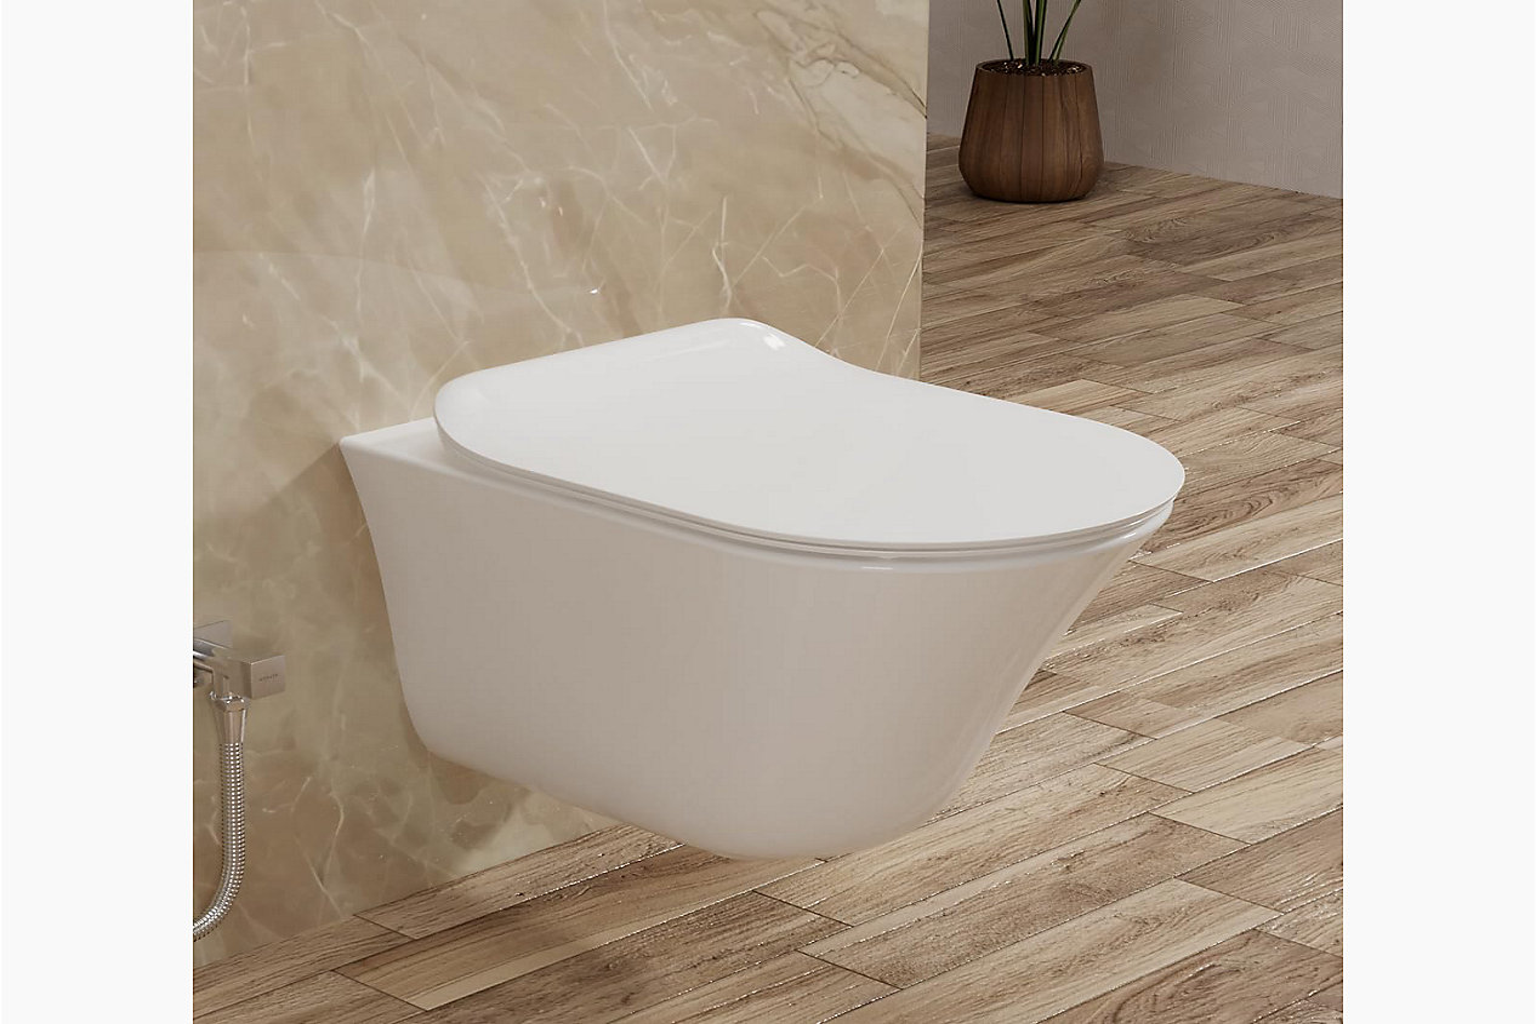
Ground Floor Male A - Stall #3
Robot R-01 · Cycle #12 · Today 10:32 AM
Verified Clean
Before
After
Before Toilet
After Toilet
Before Sink
After Sink
Before Urinal
After Urinal
Before Mirror
After Mirror
Robot Chemical & Supply Levels
R-01
Chemical Supply Monitoring
Level % = Current Volume / Max Tank Capacity × 100 Est. Cycles = Current Volume / Avg Consumption per Cycle
Green (≥50%)Sufficient supply for continued operation
Amber (25-49%)Refill recommended within next shift
Red (<25%)Critical — refill required, auto-alert sent to staff
IoT sensors in robot tanks. Real-time level monitoring. Auto-alerts at 25% threshold.
🧪Cleaning Solution
72%~18 cycles left
Multi-surface disinfectant · Tank: 2.5L / 3.5L
🚽Toilet Bowl Cleaner
38%~8 cycles left
Acid-based descaler · Tank: 0.95L / 2.5L
🚿Urinal Cleaner
85%~24 cycles left
Enzymatic urinal descaler · Tank: 3.0L / 3.5L
💧Clean Water
60%~15 cycles left
Fresh water rinse supply · Tank: 3.0L / 5.0L
🗑️Waste Water Tank
45%55% capacity remaining
Dirty water collection · Tank: 2.25L / 5.0L · Empty at ≥80%
🌿Air Freshener Cartridge
18%~4 cycles left
Eucalyptus mist cartridge · ⚠ Replace soon
Next scheduled refill:Today 2:30 PM (1h 45m)
AI Cleanliness Analysis
🤖 AI
Automated Inspection Results
ALIX robot camera captures before & after photos at each fixture. AI vision model scores cleanliness on 12 parameters.
✓
Toilet bowl - clean, no stains
✓
Seat & lid - sanitized
✓
Washbasin - clean, no residue
✓
Sink & counter - clean
✓
Mirror - streak-free
✓
Soap dispenser - filled (60%)
!
Paper towel - low (25%)
✓
Waste bin - emptied
✓
Urinal - flushed & clean
✓
Door handles - sanitized
✓
Air freshener - active
✓
No odor detected
Score by Area
Toilet & Seat96%
Urinal98%
Sink & Mirror95%
Supplies72%
Air & Odor100%
Cycle Stats
6:12
Duration (min)
4
Fixtures Cleaned
0.8L
Water Used
12
Vision Scans
Today's Cleaning Verification Log
Time
Restroom
Robot
Before
After
Quality Score
AI Verdict
Duration
Action
10:32 AM
GF Male A - Stall #3
R-01
Before
After
94%
✓ Pass
6m 12s
10:15 AM
GF Female A - Full
R-02
Before
After
97%
✓ Pass
8m 45s
09:48 AM
L2 Male - Urinals
R-04
Before
After
91%
✓ Pass
5m 30s
09:22 AM
L2 Food Court - Stall #1
R-07
Before
After
72%
⚠ Flagged
7m 18s
09:05 AM
GF Accessible
R-01
Before
After
98%
✓ Pass
4m 52s
08:40 AM
Basement Unisex - Sink Area
R-04
Before
After
58%
✗ Fail
9m 05s
Vision Verification Coverage
Toilet / Stalls100% covered
Sinks & Counters100% covered
Washbasins96% covered
Mirrors92% covered
Urinals100% covered
Supply Dispensers88% covered
Weekly Quality Score Trend
88%
Mon
91%
Tue
89%
Wed
93%
Thu
90%
Fri
95%
Sat
96%
Sun
Cleaning Verification is the trust-builder for customers. ALIX robot cameras capture before/after vision scans of every fixture. AI vision model auto-scores cleanliness on 12 parameters. Flagged items trigger human staff re-clean. Vision data is stored for SLA audits and compliance reporting. The slider comparison lets customers visually confirm quality.
Facility Issues & Maintenance
Non-cleaning issues detected by ALIX robots — escalated to maintenance staff
🔧
14
Issues Detected This Week
⏳
5
Open / Pending Resolution
⏱️
2.4 hrs
Avg Resolution Time
✅
38
Resolved This Month
Issue Types:💧 Water Leakage🪑 Broken Seat🚰 Water Clogging🔄 Faulty Flush🧴 Broken Dispenser
Issue Type Definitions
💧 Water LeakageDetected by floor moisture sensor + AI camera vision. Severity: Critical. Auto-escalated immediately
🪑 Broken SeatAI vision detects cracks, chips, loose fittings on toilet seats. Severity: High
🚰 Water CloggingWater flow sensor detects slow drain or overflow. Severity: Critical
🔄 Faulty FlushFlush mechanism sensor detects incomplete flush or button failure. Severity: Medium
🧴 Broken DispenserDispenser sensor detects jam or AI vision spots physical damage. Severity: Medium
All issues detected by ALIX robot sensors + AI vision during cleaning cycles. Auto-reported to maintenance queue.
Active Issues (5)
💧
Water Leakage - Pipe Joint
GF Male A · Under sink area
Detected by R-01 · Today 9:15 AM · Continuous drip from pipe joint
CriticalIn Progress👷 Rajesh K.
🪑
Broken Toilet Seat - Cracked Hinge
L2 Female · Stall #2
Detected by R-04 · Today 8:42 AM · Left hinge cracked, seat unstable
HighAssigned👷 Kumar S.
🚰
Water Clogging - Slow Drain
GF Male B · Stall #1
Detected by R-02 · Today 7:58 AM · Toilet drain rate 80% slower than normal
CriticalOpenUnassigned
🔄
Faulty Flush Mechanism
L2 Food Court · Stall #3
Detected by R-07 · Yesterday 4:30 PM · Button press not triggering full flush
💧Robot Vision Capture9:15 AM - Water pooling detected under sink pipe
🤖 AI Confidence: 94.7%
🤖 AIAuto-Generated Issue Report
Moisture sensor triggered at 9:15 AM under sink unit in GF Male A. Robot camera confirmed water pooling (est. 200ml) originating from the hot water pipe joint. Drip rate: ~2 drops/sec. Risk of floor damage if unresolved within 4 hours.
Resolution Timeline
Detected
9:15 AM · Robot R-01 moisture sensor + camera
Auto-Reported
9:15 AM · Ticket #FM-2024-0147 created, SMS sent to supervisor
Assigned
9:22 AM · Rajesh K. (Plumber) acknowledged
In Progress
9:45 AM · Technician on-site, inspecting joint
Resolved
Pending · Est. completion: 11:00 AM
Est. Repair Time
1.5 hrs
Priority Level
P1
Parts needed: Pipe joint seal, Teflon tape, Wrench set
Maintenance History — GF Male A
💧Pipe leak (same joint)
Mar 18 · Fixed in 1.8h
🚰Drain slow
Mar 5 · Fixed in 0.5h
💧Pipe leak (same joint)
Feb 22 · Fixed in 2.1h
🔄Flush valve weak
Feb 10 · Fixed in 1.0h
🤖 AIPreventive Maintenance Recommendation
This pipe joint has leaked 3 times in 6 weeks. Patch repairs are no longer effective. Recommend full pipe section replacement during next scheduled maintenance window (est. 4 hrs). This will prevent recurring emergency callouts and reduce downtime by ~85% for this restroom.
Weekly Issue Trend
↓ 23% vs last month
3
2
1
W1
2
3
2
W2
1
2
3
W3
1
1
1
W4
Critical Medium/High Low
Issue Trend Chart
Issues per Week = Count of new issues detected by severity level
Green ArcPercentage of SLA events that were compliant
Grey ArcPercentage of SLA events that breached
Target: 95%Contractual SLA target agreed with customer
All SLA events for selected month. Weights configurable in SLA & Policy page.
SLA Breakdown
Max Time Between Cleans (60m)97.8%
Incident Response (10m)95.4%
Min Daily Cycles (6/day)91.2%
Quality Score (90%+)98.1%
SLA Breakdown Details
Each SLA % = Compliant Events / Total Events for that category × 100
Clean Interval% of restrooms cleaned within 60-min max. Measured: last clean timestamp to next clean start
Incident Response% of incidents where first response was within 10 min of detection
Daily Cycles% of restrooms that received ≥6 cleaning cycles in the day
Quality Score% of cleaning cycles where AI quality score was ≥90%
Green Bar≥95% compliance — meeting SLA target
Amber Bar90-94% — below target, needs attention
Calculated from task logs, incident timestamps, and AI scores. Monthly aggregation.
Breach Summary
7
Total Breaches This Month
↓ 58% from last month (17)
Cleaning interval exceeded4
Slow incident response2
Missed daily cycle target1
Breach Summary
Total Breaches = Count of SLA events where target was exceeded Trend = (Current Month Breaches - Last Month) / Last Month × 100
Interval ExceededRestroom not cleaned within 60-min max window
Slow ResponseIncident not attended within 10-min SLA
Missed CycleRestroom received <6 cleans in a day
↓ 58%(7 current - 17 last month) / 17 × 100 = 58% reduction
From SLA monitoring engine. Each breach auto-logged with root cause analysis.
Breach Log
March 2026
Date & Time
Restroom
SLA Type
Breach Duration
Root Cause
Resolution
Mar 28, 14:22
GF Male B
Interval
8 min overdue
Robot charging, no backup
Resolved
Mar 27, 11:45
L2 Food Court
Response
12 min late
Peak hour congestion
Resolved
Mar 25, 09:10
L3 Office Wing
Interval
5 min overdue
Staff break overlap
Resolved
Mar 22, 18:30
GF VIP Lounge
Interval
11 min overdue
VIP event overflow
Resolved
Mar 18, 13:05
L2 Female
Response
7 min late
Sensor delay
Resolved
Multi-Site SLA Comparison
For customers managing multiple facilities
Facility
Compliance
Breaches
Avg Response
Health Score
Status
Marina Bay Tower A
97.2%
3
3.1 min
94%
Excellent
Marina Bay Tower B
96.2%
7
3.8 min
92%
Good
Orchard Road Mall
93.5%
12
4.5 min
88%
Needs Review
Changi Terminal 3
98.8%
1
2.4 min
97%
Excellent
SLA Compliance is critical for contract renewals. The breach log with root cause analysis shows transparency. Multi-site comparison helps portfolio managers benchmark facilities. PDF export is essential for quarterly business reviews.
Request a Pilot
Start your ALIX journey in 4 simple steps
1
Assessment
Tell us about your facility. We analyze your restroom layout, traffic patterns, and current operations.
2
Custom Plan
We design a tailored deployment plan with robot count, zones, and SLA targets specific to your needs.
3
Pilot Deploy
30-day pilot with 2-4 ALIX robots. Full monitoring, reporting, and dedicated support included.
4
Scale Up
Review pilot results, optimize configuration, and expand to full facility coverage.
Facility Assessment Form
What's Included in the Pilot
🤖
2-4 ALIX Robots
Fully configured for your restroom layout
📊
Full Analytics Dashboard
Real-time monitoring and reporting from day 1
👨💼
Dedicated Support Manager
On-site setup + remote support throughout
📋
Comprehensive Pilot Report
Before/after analysis, ROI proof, recommendations
🔄
No Long-term Commitment
30-day trial. Scale up only if you're convinced
Ready to transform your restroom operations?
Join 50+ facilities across Southeast Asia already using ALIX
The pilot request page is the conversion funnel. Simple form + clear value props reduce friction. The 4-step process sets expectations. CTA banner reinforces social proof ("50+ facilities").
Screen 1/6: Operations Overview
Ground Floor Male A
Ground Floor · Zone A · Capacity: 6 stalls + 4 urinals